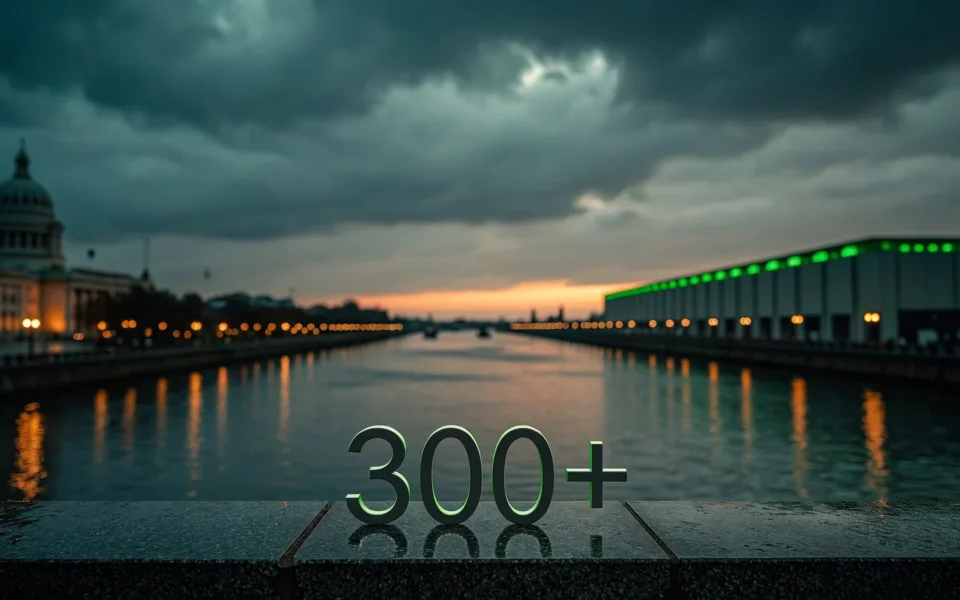
Picture every steel mill and aluminum plant in America running for a full year. A few hundred data centers draw about as much electricity.
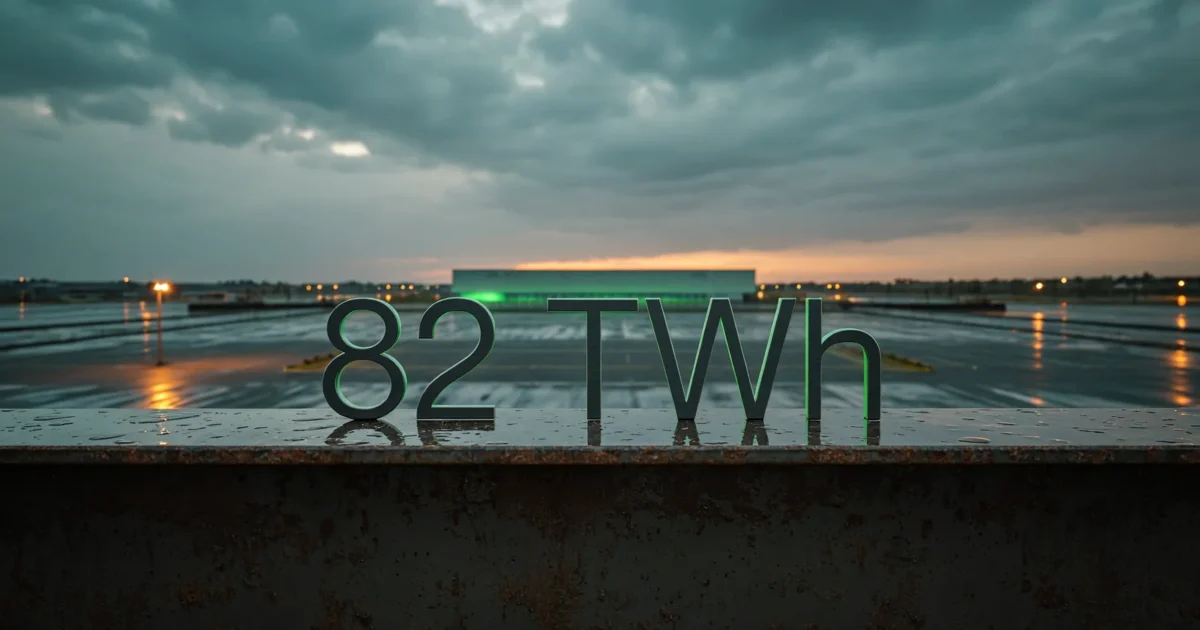
A study in Nature Sustainability, published November 16, 2026, counted 403 hyperscale data centers. That’s the largest and most powerful class, the kind that runs cloud computing and AI. They used about 82 terawatt-hours of electricity between May 2024 and April 2025. A terawatt-hour is a billion kilowatt-hours.
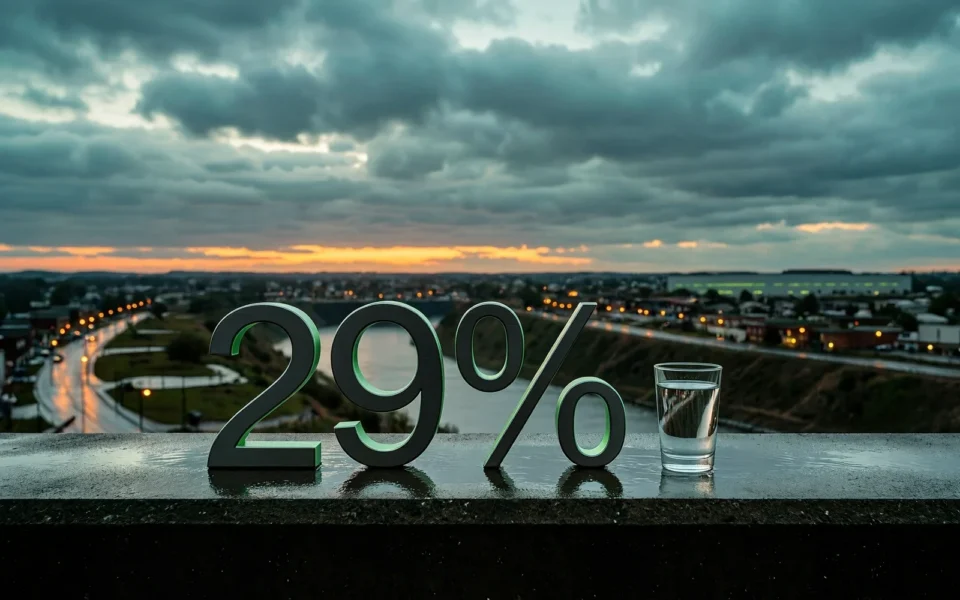
That’s roughly 1.8% of all US electricity consumption in the study period, according to Harvard’s release, and it came with 25.7 million metric tons of carbon dioxide. The researchers say today’s numbers are likely much higher.
The steel and aluminum yardstick
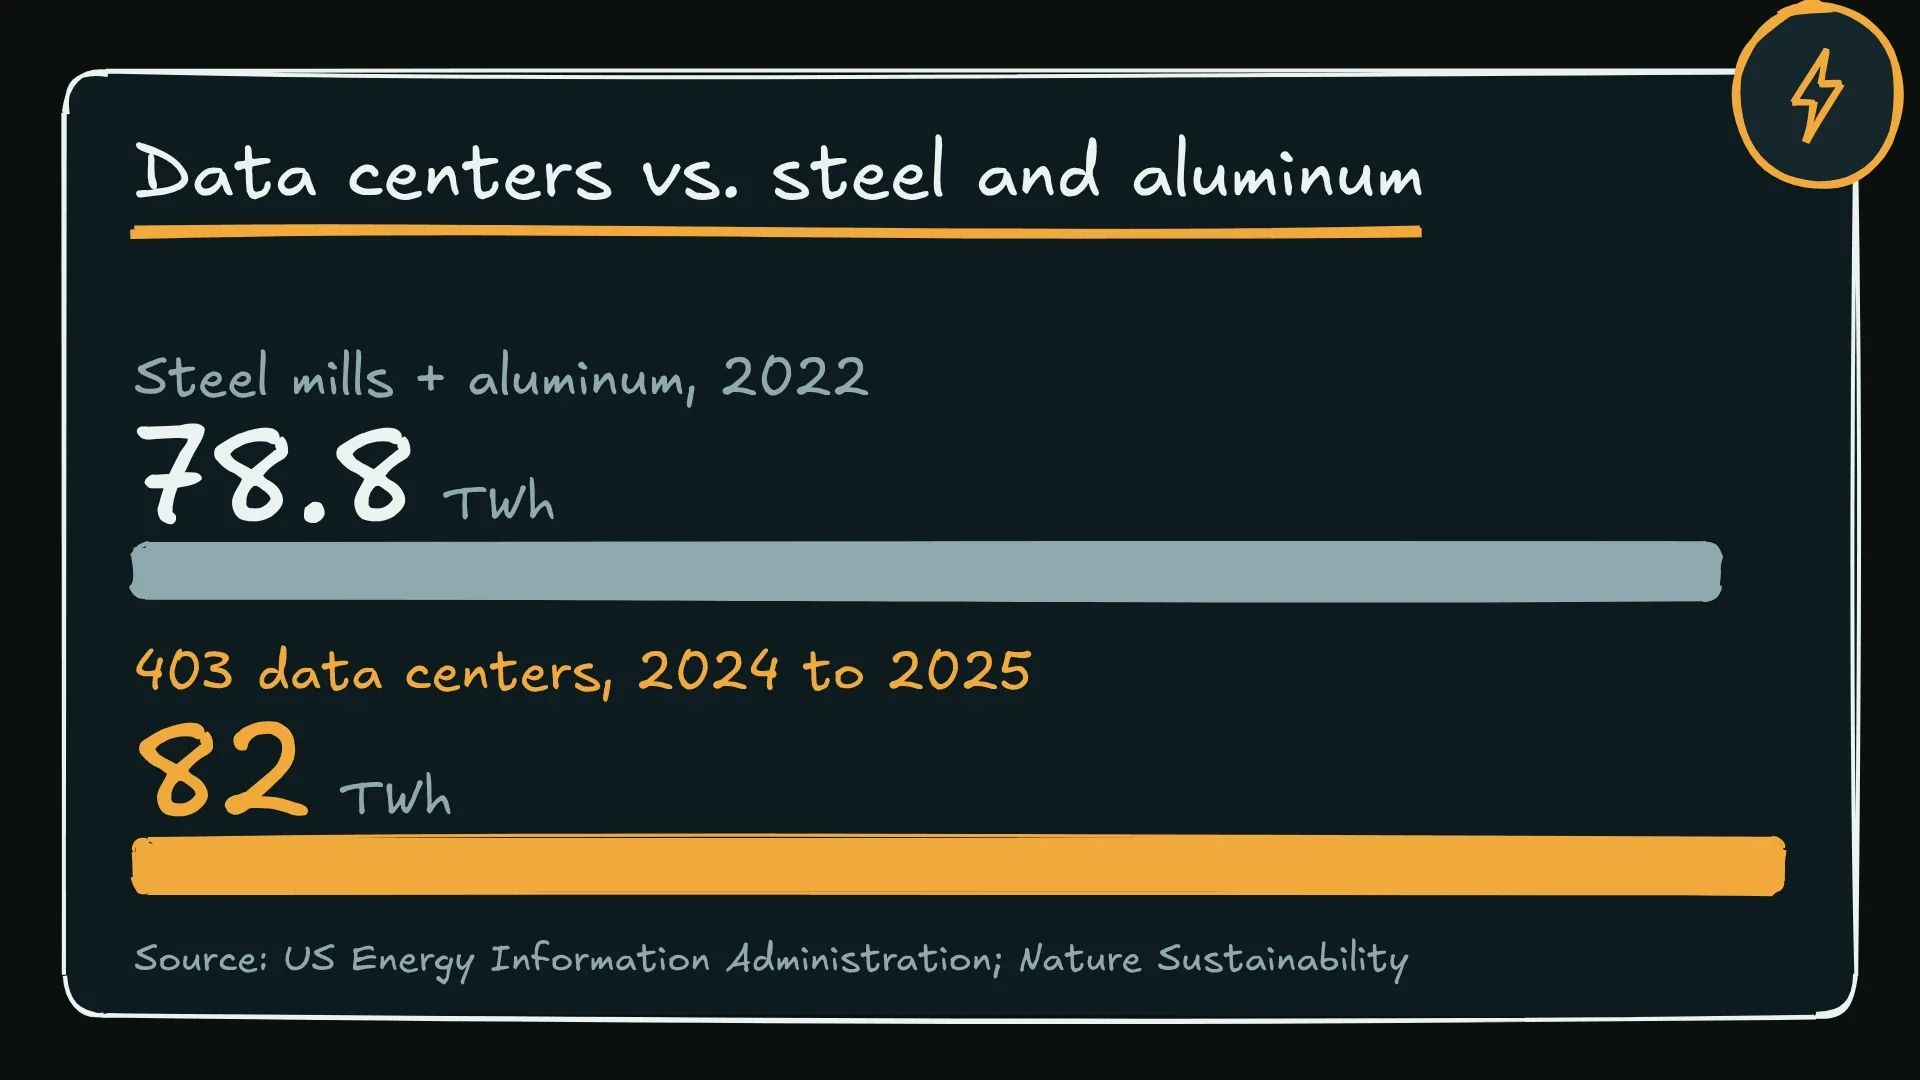
The US Energy Information Administration (EIA) tracks factory power use. Its 2022 survey puts iron and steel mills at 58.5 terawatt-hours and aluminum production at 20.3. That’s 78.8 combined, a little under the data centers’ 82.
We added those two lines ourselves, and the years differ, so it’s a yardstick, not a ranking. The study’s full range runs from 68 to 99 terawatt-hours, depending on how hard the machines ran. At the top of that range, the data centers approach the yearly use of states such as Indiana, Michigan and Tennessee, according to Harvard’s release.
Lead author Gianluca Guidi told National Geographic that a few hundred buildings are consuming as much as an entire state.
How the researchers counted
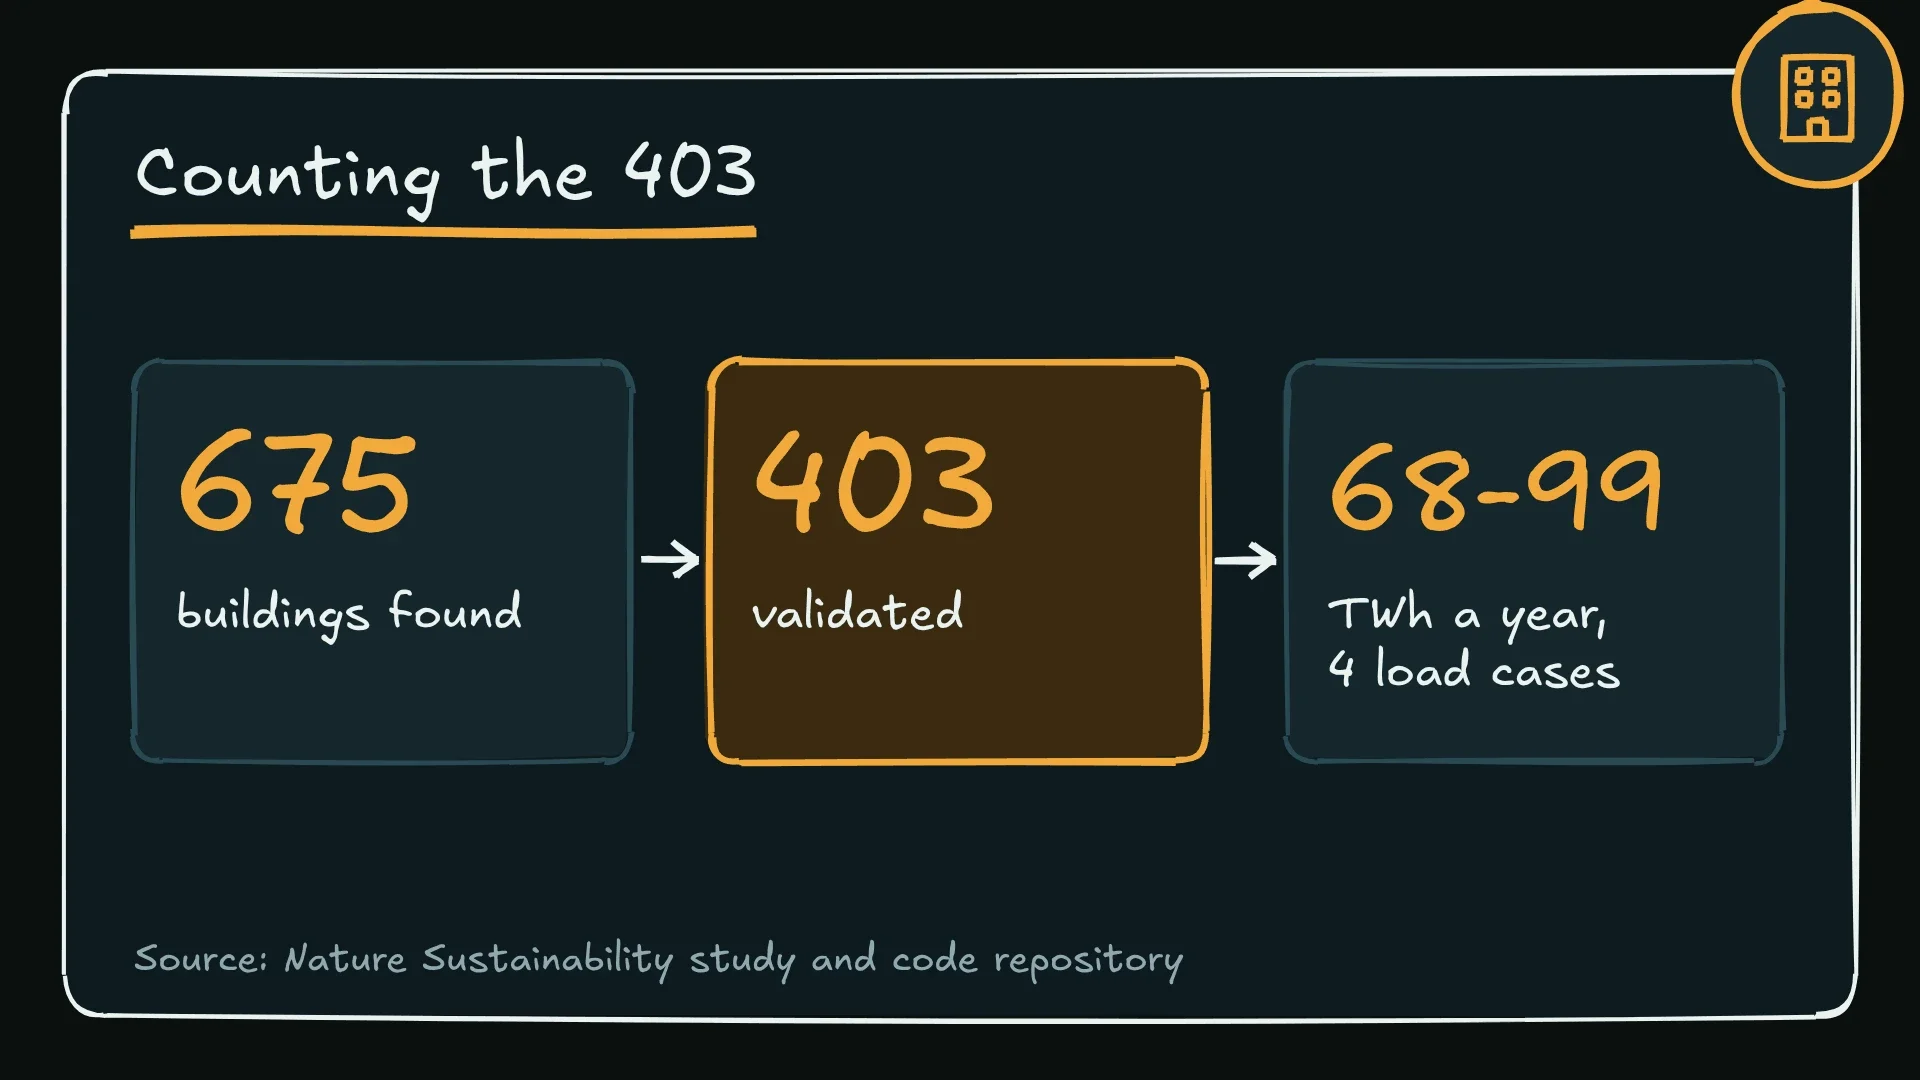
They used satellite imagery to build a list of hyperscale facilities, then estimated each building’s electricity use over the year, according to Harvard’s release. The project’s code repository describes an initial universe of 675 facilities, narrowed to the 403-facility sample behind the headline numbers.
Nobody read a meter. The study models each building’s power capacity, then applies a facility-load coefficient for how hard it runs. The central case uses 0.58 and gives 81.8 terawatt-hours. The low case, 0.48, gives 67.7. The AI-weighted high case, 0.70, gives 98.7.
Four states hold most of it
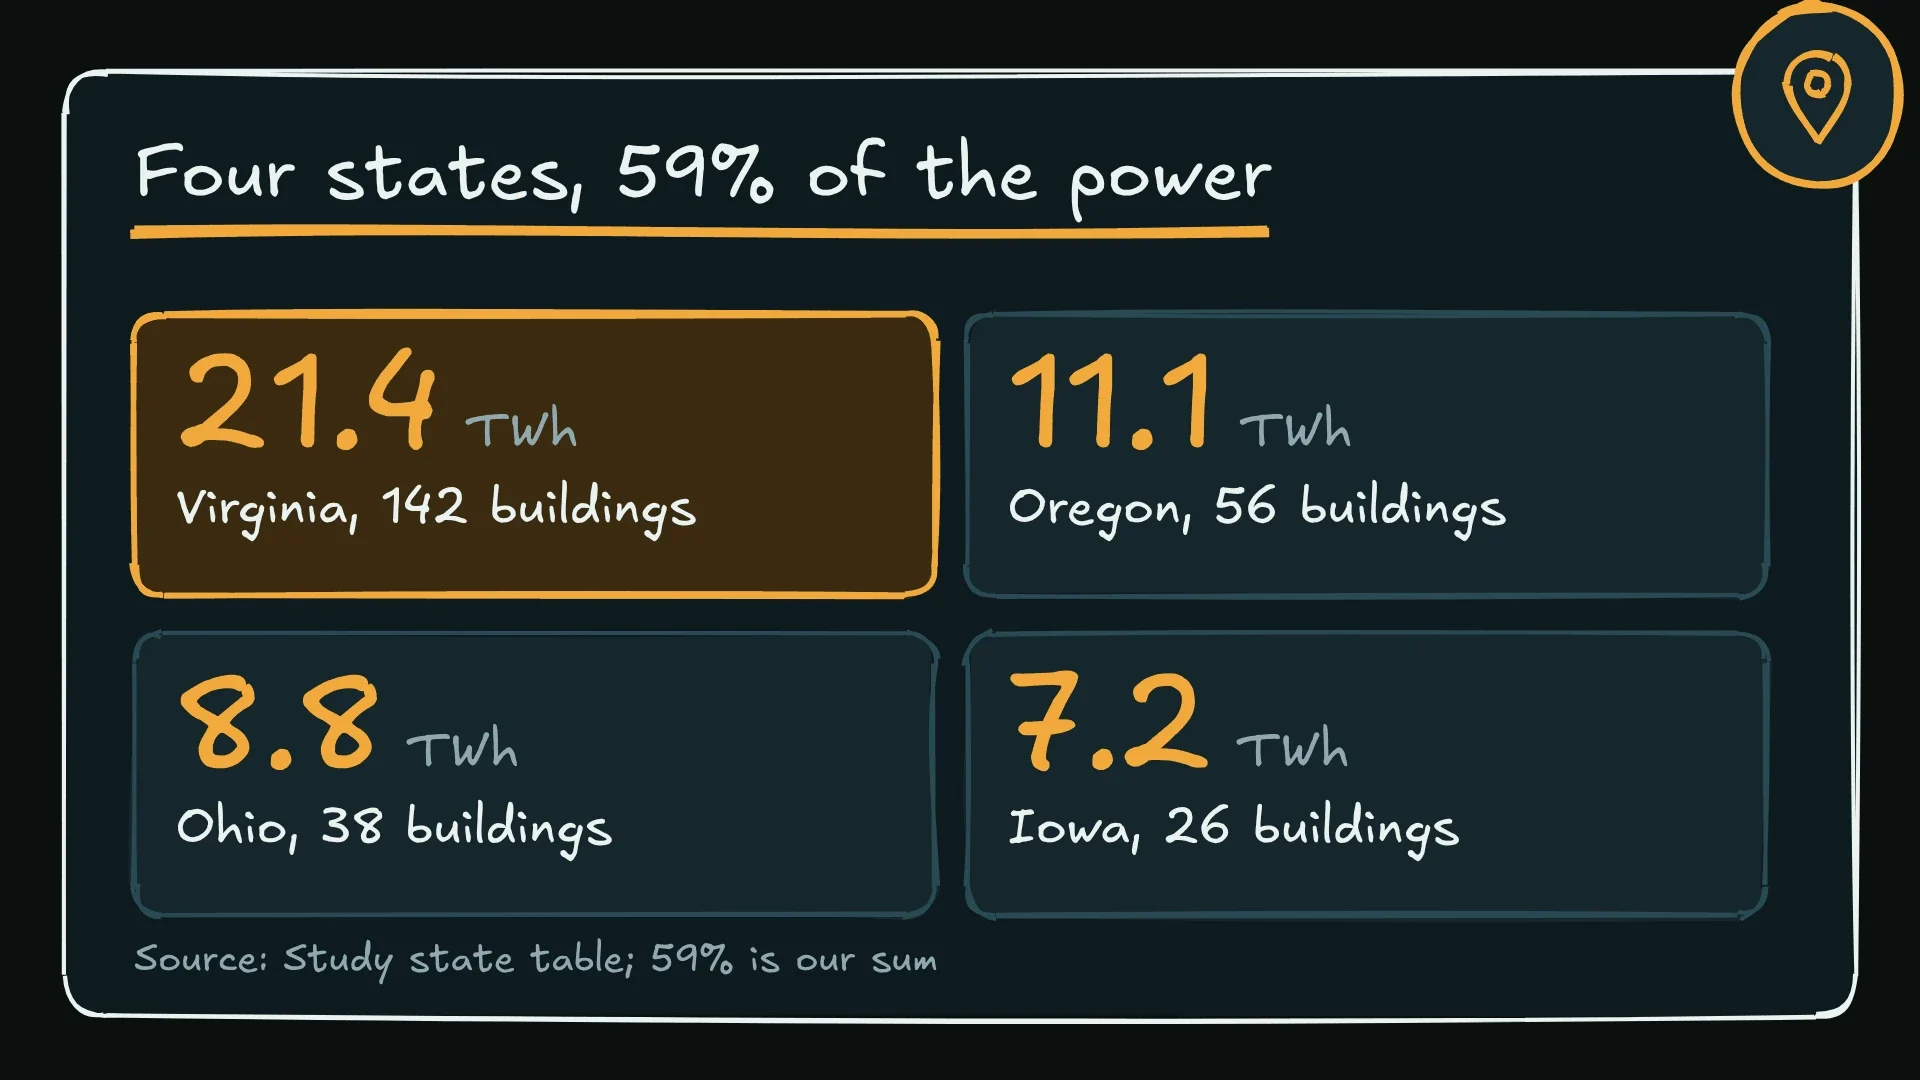
Virginia carries the most weight. It has 142 of the 403 buildings, ahead of Oregon with 56 and Ohio with 38. Virginia alone accounts for about a quarter of the estimated demand, 21 terawatt-hours, according to Nature Portfolio.
Virginia, Oregon, Ohio and Iowa together make up more than half. Adding the four rows of the study’s public state table gives 48.5 of the 81.8 terawatt-hours, or 59%. That sum is ours.
Fossil-fueled, and uneven
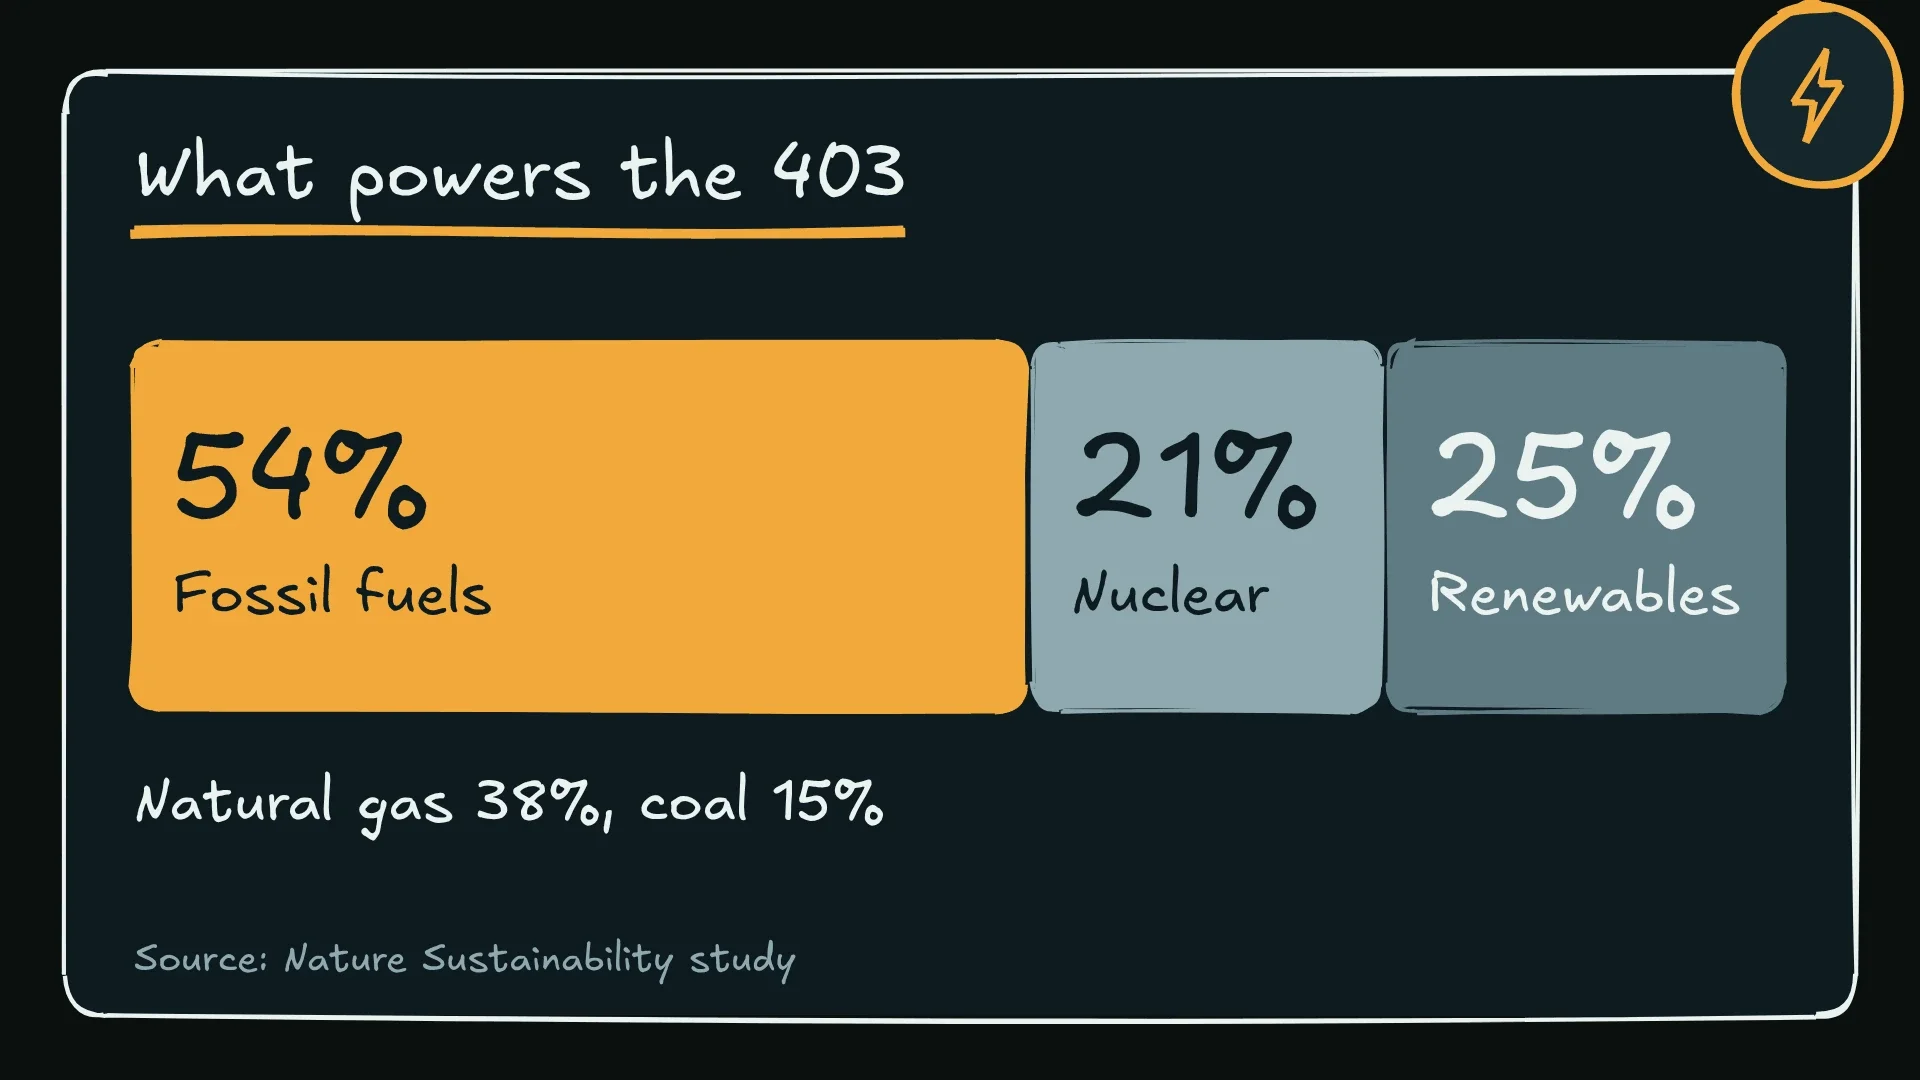
Fossil fuels supplied about 54% of the electricity, mainly natural gas at 38% and coal at 15%. Nuclear supplied 21% and renewables 25%. The researchers attribute 25.7 million metric tons of carbon dioxide to the year, within a range of 21 million to 31 million. That’s two to three times an earlier estimate for 2018.
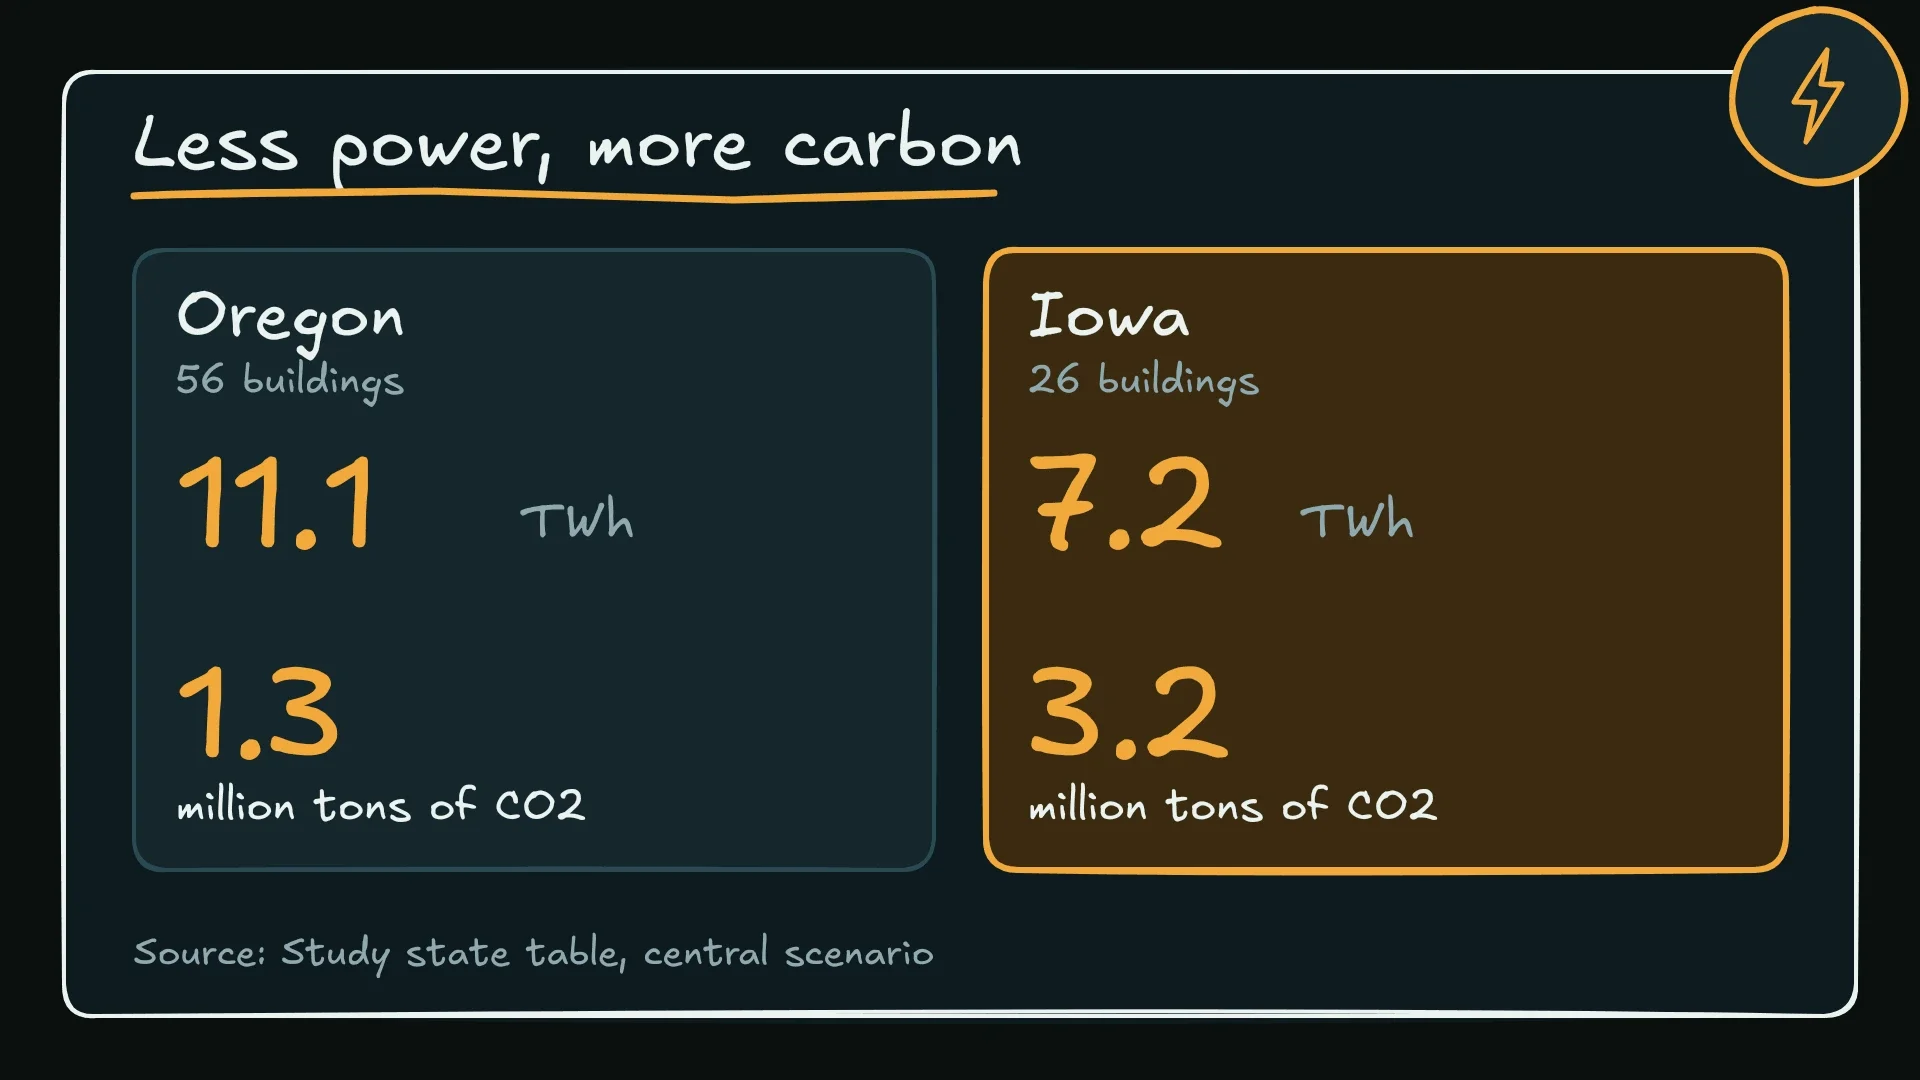
Where a building sits matters as much as its size. The state table has Oregon’s 56 data centers using 11.1 terawatt-hours and tied to 1.3 million tons of carbon dioxide. Iowa’s 26 use 7.2 terawatt-hours, about two-thirds as much, and are tied to 3.2 million tons, more than twice as much. The grid explains it: 119 grams of CO2 per kilowatt-hour in Oregon, 445 in Iowa.
Virginia’s buildings account for about 7 million tons, 27% of the total. On average, the power was slightly cleaner than the national mix: 314 grams of CO2 per kilowatt-hour, against 348 for the US overall. About a quarter of it sat in grid regions dirtier than average, though, and many facilities were concentrated where coal plants generate heavily, according to Harvard. The total is large because the draw is large.
What the estimate leaves out
The numbers are modeled. The researchers estimated each building’s load under a range of operating scenarios instead of reading meters, and they assigned emissions from each region’s annual grid mix. They also assessed 403 validated facilities, not every US hyperscale data center. Corresponding author Francesca Dominici calls it a “floor estimate,” the South China Morning Post reports.
The data couldn’t separate power used for general-purpose computing from AI-specialized work at each site, according to Harvard, and the study didn’t measure health effects. Those are for future research.
The study window also closed in April 2025. Guidi says in Harvard’s release that new facilities have been built and existing campuses have expanded since.
“The industry is growing faster than anyone can track it.”
Guidi, the study’s lead author and a postdoctoral fellow in biostatistics at the Harvard T.H. Chan School of Public Health, told CBS News in a report published November 18, 2026.
Looking ahead, the authors have published state and grid-region totals on GitHub, so anyone can check a region’s share. Dominici says decisions on where data centers go and how they’re powered should rest on good data. For readers in New Zealand and Australia, the lesson is the yardstick: ask how a new data center compares with the industries already on the local grid. In September we reported on Southland’s AI data center, approved without public input.
Sources
- Nature Sustainability, Assessing the carbon emissions and energy consumption of US hyperscale data centres
- Harvard T.H. Chan School of Public Health, news release of November 16, 2026
- Nature Portfolio, summary of the study
- US Energy Information Administration, 2022 Manufacturing Energy Consumption Survey, Table 11.1
- National Geographic
- CBS News
- South China Morning Post